
Site IQ Analytics Explainer
Welcome to our Analytics Explainer page, your go-to resource for answers to around the Site IQ analytics portal. If you have a question that’s not answered, ask your Site iQ point of contact to pass it on to us.
Navigate to:
Energy
Overview
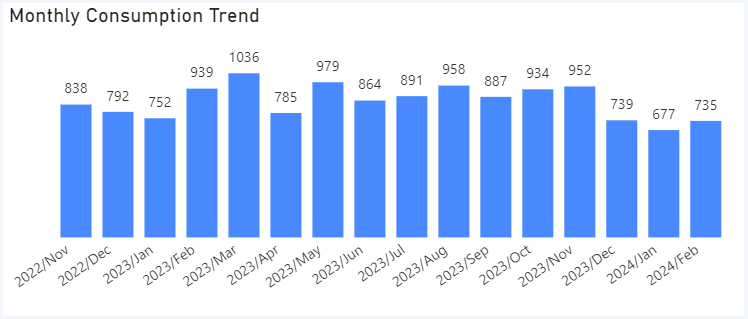
Monthly Consumption Trend
The monthly consumption trend chart displays the monthly plug-load energy usage for your building in kWh based on the selected date range.
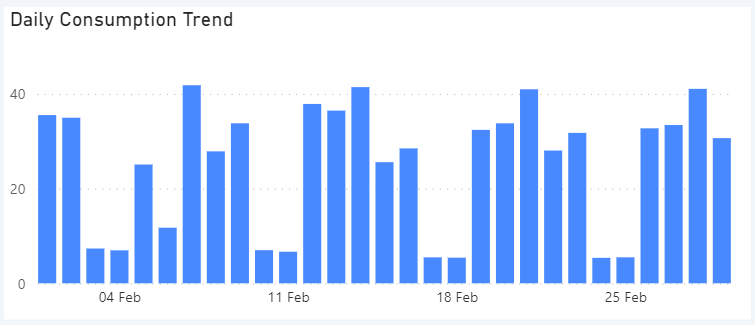
Daily Consumption Trend
The daily consumption trend chart displays the daily plug-load energy usage for your building in kWh based on the selected date range.
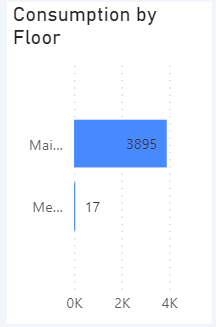
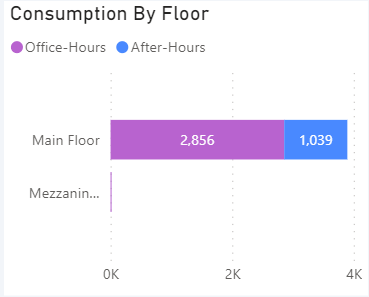
Consumption by Floor
The consumption by floor chart displays to the total consumption per building floor based on the selected date range.
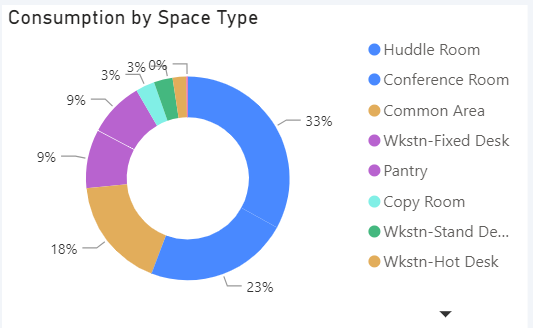
Consumption by Space Type
The Consumption by Space Type chart displays to the total consumption in kWh per space type for the selected date range.
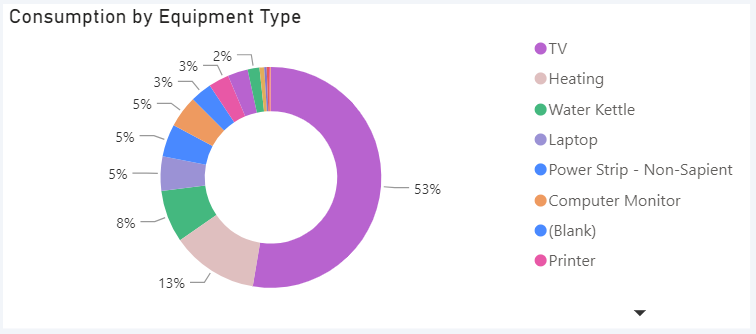
Consumption by Equipment Type
The Consumption by Equipment Type chart displays to the total consumption in kWh for different types of equipment in your building.
Note: A general workstation is considered an Integrated workstation powerstrip or Powerstrip – non Sapient.
After-Hours
After-hours consumption metric
This metric displays to total consumption in kWh used outside of operating hours as logged in the control portal, for the selected date range.
% After-hours consumption
This metric displays to total proportion of consumption used outside of operating hours for the selected date range.
% Hours Considered After-Hours
This metric shows the total proportion of hours in a working week that are considered non-operating hours.
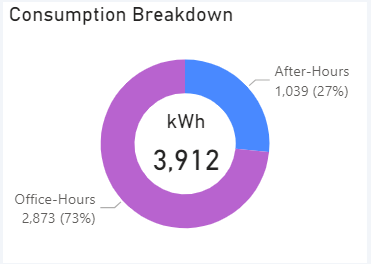
Consumption Breakdown
This chart displays the proportion of consumption used during operating hours vs. what is used after hours. It includes a % proportion of energy used as well as the value in kWh.
After-Hours Consumption
This time-series chart shows hourly energy consumption for after hours usage overlaid with overall consumption (in kWh)

After-Hours Consumption By Floor
This chart shows the total energy consumption in kWh by floor. The purple energy consumption is used during operating hours. The blue energy consumption is used outside of operating hours.
After-Hours Consumption By Space Type
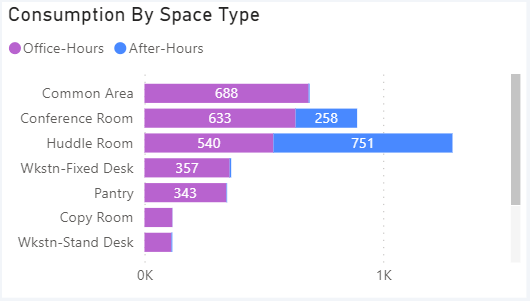
This chart shows the total energy consumption in kWh by space type. The purple energy consumption is used during operating hours. The blue energy consumption is used outside of operating hours.
After-Hours Consumption By Equipment Type
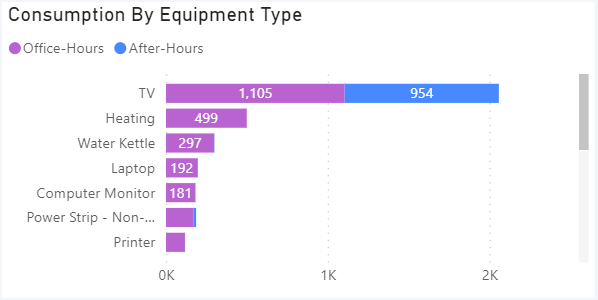
This chart shows the total energy consumption in kWh by equipment type. The purple energy consumption is used during operating hours. The blue energy consumption is used outside of operating hours.
Baseline comparison
To use the baseline comparison reporting, select 2 equivalent date ranges using the date pickers at the top of the screen. This will compare energy consumption statistics for these two periods.
Baseline Comparison – Total
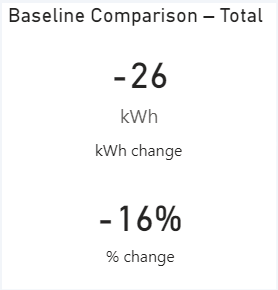
This metric shows the total difference in energy consumption between the baseline period and the comparison period. This is shown as a +/- kWh figure and a % difference.
Baseline Comparison – Baseline Period Consumption
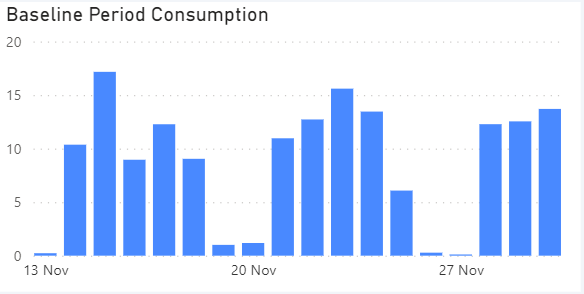
This time-series chart shows the daily energy consumption in kWh for the selected baseline date range. This is supported by metrics which include:
- The total number of days in the period selected.
- The total number of hours that are outside of operating hours.
- The total kWh consumed during this period.
- The total kWh consumed outside of operating hours.
Baseline Comparison – Comparison Period Consumption
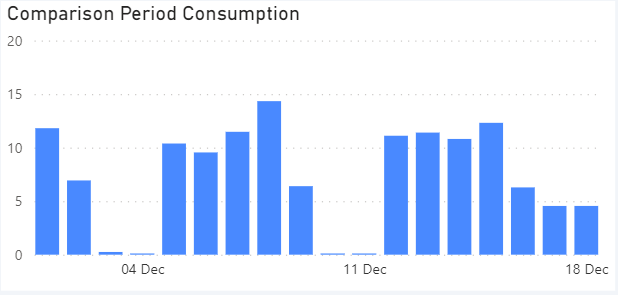
This time-series chart shows the daily energy consumption in kWh for the selected comparison date range. This is supported by metrics which include:
- The total number of days in the period selected.
- The total number of hours that are outside of operating hours.
- The total kWh consumed during this period.
- The total kWh consumed outside of operating hours.
Device Level comparison
To use the device level comparison reporting, select 2 equivalent date ranges using the date pickers at the top of the screen. Select the sensors or floors you would like to compare. This will compare energy consumption statistics for these two periods.
Energy Overlay
This time-series chart shows the aggregated hourly consumption based on a selected date range for the baseline period and comparison period. This is supported by a grid below this chart which contains:
- The specific equipment details (name, space and floor)
- Total Consumption kWh used by equipment for data range for comparison period.
- Total after hours consumption in kWh

Workplace
Workplace analytics provide you with a view of your occupancy and utilisation levels for your building. This allows you to optimise your workstation and space requirements, and make informed decisions on future leasing.
Determining Occupancy and Utilisation
Occupancy ratings apply to any equipment that is tagged as a workstation. Occupancy is recorded at 15-minute intervals based on the following conditions:
To have an occupancy status of “occupied” the following conditions must be checked and met:
- Average Real Power > 20 wh
- Average Real Power > 1.4*Average Real Power during the Baseline Period
- Standard Deviation of the Real Power > 1.2*Standard Deviation of the Real Power During the Baseline Period
Utilisation is defined as the proportion of workstations that are occupied compared to the total number of workstations for a given period of time.
Occupancy Overview
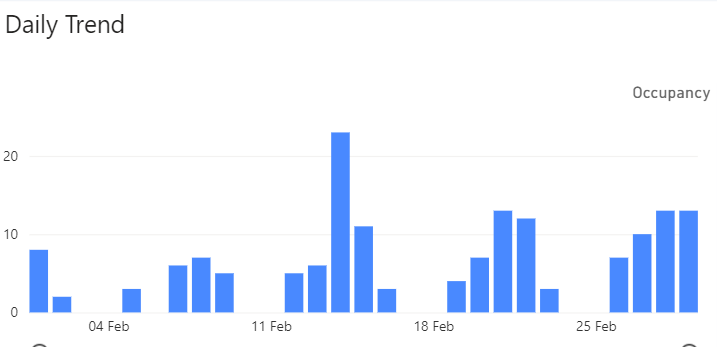
Daily Trend – Occupancy
This chart displays the daily occupancy rates for your building based on a selected date range. Use the filters located on the right corner of the screen to delve into a floor, space or department.
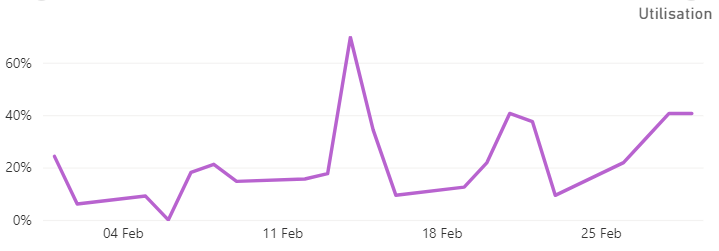
Daily Trend – Utilisation
This chart displays the % daily utilisation for your building based on a selected date range. Use the filters located on the right corner of the screen to delve into a floor, space or department.
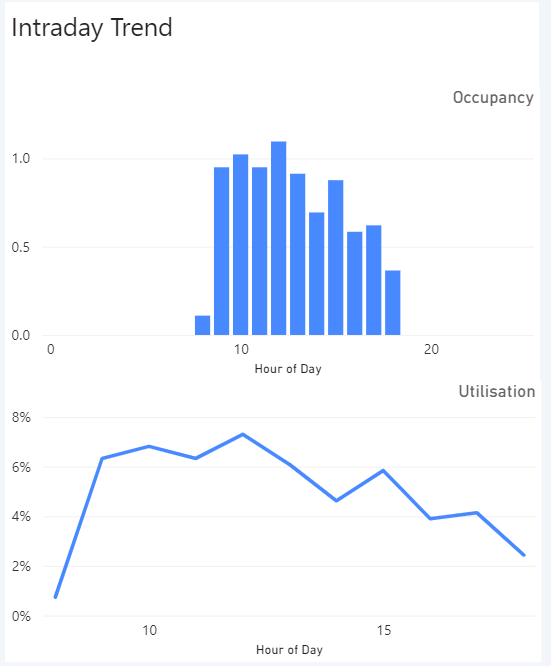
Intraday Trend
These charts displays the occupancy and % daily utilisation for your building based on a selected date range. Use the filters located on the right corner of the screen to delve into a floor, space or department.
Floors
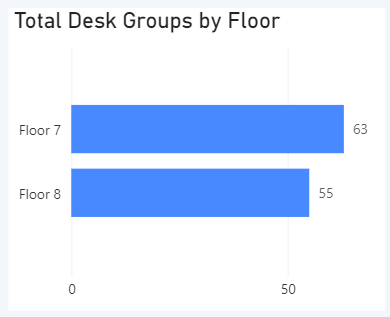
Total Desk Groups (Workstations) by Floor
This chart displays to total number of workstations per floor of a building. Use the date filters to see how this has changed over periods of time.
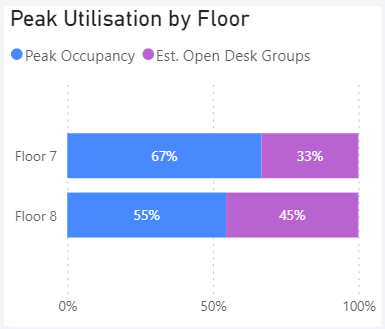
Peak Utilisation by Floor
This chart displays the maximum % utilisation per floor based on the number of occupied workstations. The blue bar represents the floor workstations occupied, whereas the purple represents unoccupied workstations. Use the date filters to see how this has changed over a period of time.
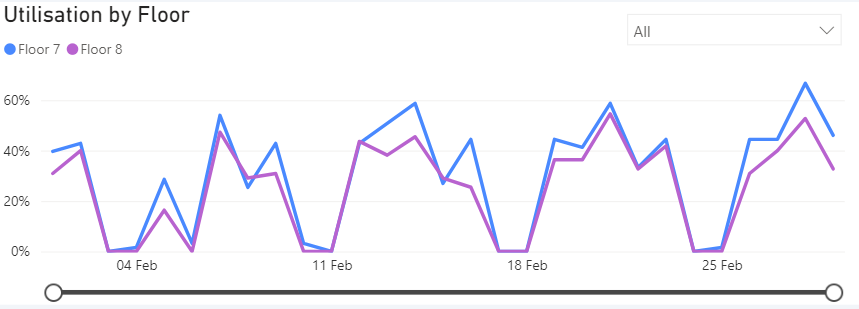
Utilisation by Floor (Time-series)
This time-series chart displays the % daily utilisation per floor based on the number of occupied workstations. Each line represents a particular floor in your building. Use the built-in slider or day selector to drill into and view further insights into particular days of the week.
Day Trends
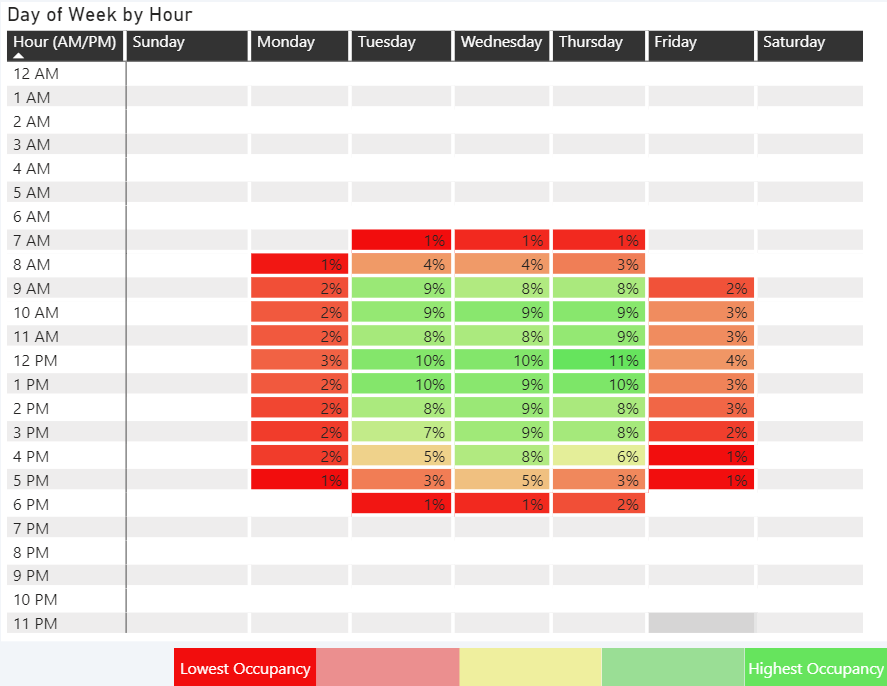
Day of Week by Hour
This heat map chart shows average % occupancy for your building for the days of the week and hours of the day.
The green represents peak occupancy periods whereas the red represents lower occupancy periods.
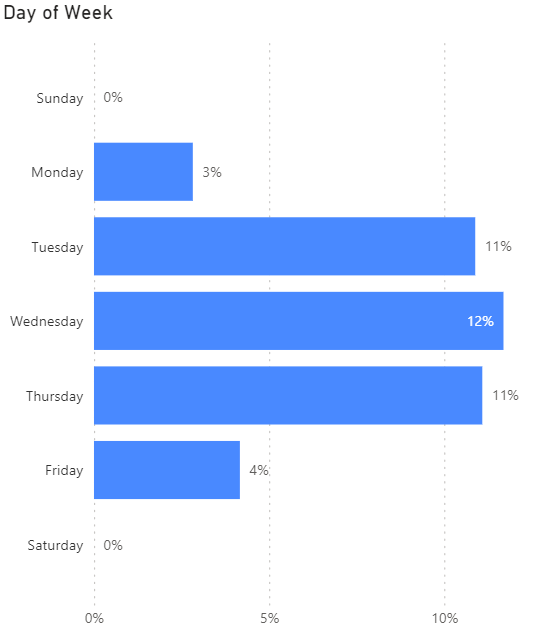
Day of Week
This chart shows average daily utilisation % for your building for the days of the week.
Distribution of Desks Utilisation (Hours per day)
Distribution of Desks Utilisation (Hours per day)
This chart shows average number of hours each desk has utilised a

Desk Utilisation Grid
This grid shows each individual workstation, the average daily utilisation % and the average number of hours the workstation is occupied.

Conference Rooms
Distribution of Desks Utilisation (Hours per day)
This chart shows the where meeting or conference rooms are occupied through the working day at 15 minute intervals.

Glossary
A workstation is defined as having and Occupied status when the power profile of the electronic equipment associated with that workstation indicate human presence. This is evaluated on hourly interval and used throughout the analytics portal to determine other metrics as defined below.
Total Capacity is defined as the total number of workstations in the selected space.
Occupancy is defined as the quantity of concurrent workstations showing an Occupied status in a given space for any specified hourly interval.
Utilisation is defined on an hourly basis as the Occupancy divided by the Total Capacity in the given space.
Daily Occupancy is defined on a daily interval as the total number of workstations in a given space that had shown at least one hour with Occupied status over the course of that day.
Daily Utilisation is defined on a daily interval as the Daily Occupancy for that day divided by the Total Capacity of the given space.
Average Occupancy is defined across as the average of Daily Occupancy across the days in the selected time period.
Peak Occupancy is defined as the highest Daily Occupancy across the days in the selected time frame.
Open Desks are defined as the Total Capacity less the Peak Occupancy. This metric helps workplace strategist understand how many open workstations there are on even the busiest days in their building.
Unused Desks are defined as the quantity of workstations that had shown Occupancy on less than 10% of the number of working days in the selected period. This metric helps identify how many unique workstations are consistently underutilised in the space.
Average Dwell Time is defined as the average number of hours a workstation is used on days where there is occupancy at that workstation. This metric helps identify the average number of hours occupants are actively using their workstations when they are in the space.